ORGANISATION
FOR ECONOMIC CO-OPERATION
Pursuant
to Article 1 of the Convention signed in Paris on 14th December 1960, and which
came into force on 30th September 1961, the Organisation for Economic
Co-operation and Development (OECD) shall promote
policies
designed:
–
To achieve the highest sustainable economic growth and employment and a rising
standard of living in Member countries, while maintaining financial stability,
and thus to contribute to the development of the world economy.
–
To contribute to sound economic expansion in Member as well as non-member
countries in the process of economic development. And
–
To contribute to the expansion of world trade on a multilateral,
non-discriminatory basis in accordance with international obligations.
The
original Member countries of the OECD are Austria, Belgium, Canada, Denmark,
France, Germany, Greece, Iceland, Ireland, Italy, Luxembourg, the Netherlands,
Norway, Portugal, Spain, Sweden, Switzerland, Turkey, the United Kingdom and the
United States. The following countries became Members subsequently through
accession at the dates indicated hereafter: Japan (28th April 1964), Finland
(28th January 1969), Australia (7th June 1971), New Zealand (29th May 1973),
Mexico (18th May 1994), the Czech Republic (21st December 1995),
Hungary (7th May 1996), Poland (22nd November 1996), Korea (12th December 1996)
and the Slovak Republic (14th December 2000).
7
© OECD 2001
There
is a clear trend
in
the OECD area towards
a
knowledge-based economy…
The
ability to create, distribute and exploit knowledge is increasingly
central
to competitive advantage, wealth creation and better standards of
living.
The STI Scoreboard 2001 presents the latest OECD indicators on the
knowledge-based
economy. Many are new, and they are brought together for
the
first time in one publication. As a range of new indicators show, the
knowledge-intensity
of OECD economies is increasing. Investment in
knowledge,
particularly in R&D and software, is rising, as is investment in ICT.
Moreover,
the composition of investment is changing, particularly in R&D
where
a growing proportion is funded by business. Knowledge flows within
and
across OECD economies are increasing as well, as shown by growing
co-operation
in science and innovation, greater international mobility of
high-skilled
workers and continued globalisation of trade and investment.
Information
and communications technologies are also spreading quickly and
support
more rapid knowledge creation and diffusion.
…
which is reflected in the
economic
and innovative
performance
of certain OECD
countries.
The
knowledge-based economy is also reflected in the economic
performance
of several OECD countries. High-technology sectors contribute
to
more rapid growth in some, and the share of these sectors – both in
manufacturing
and services – continues to grow. Moreover, the overall
efficiency
of capital and labour has increased in some OECD countries in the
1990s,
partly owing to more rapid technological progress. Indicators of
patenting
confirm the swift pace of innovation.
Nevertheless,
large differences
continue
to
mark the move towards
a
knowledge-based economy.
While
the overall trends are clear, large differences remain within the
OECD
area. The Nordic countries, notably Finland and Sweden, and the
United
States appear to be in the lead in the transition to a knowledge-based
economy,
as high investment in knowledge, rapid innovation and the pace of
diffusion
of ICT indicate. Countries such as Japan and several large European
countries
appear to lag in important areas, including investment in
knowledge,
innovation and growth of a high-skilled workforce. For certain
OECD
countries, openness to international knowledge flows also seems to
lag.
This suggests scope for further progress. However, the transition to a
knowledge-based
economy requires progress in many areas, and even
countries
that are ahead in many of them lag in others.
New
indicators show that the knowledge-intensity of OECD economies
is
increasing
Investment
in knowledge
is
growing more rapidly than
investment
in
fixed capital…
Investment
in knowledge, defined as public and private spending on
higher
education, expenditure on research and development (R&D) and
investment
in software, accounts for about 4.7% of OECD-wide GDP. It would
exceed
10% of GDP if education expenditure for all levels was included. By
this
measure, Sweden, the United States, Korea and Finland are the four most
knowledge-based
economies. During the 1990s, investment in knowledge
increased
by 3.4% annually in the OECD area, while investment in fixed
capital
increased by 2.2%.
OECD,
STI Scoreboard 2001
…
and ICT has been the most
dynamic
element.
ICT
hardware and software have been the most dynamic area for
investment.
The available data show that it rose from less than 15% of total
non-residential
investment in the business sector in the early 1980s to
between
15% and 35% in 1999. Investment in software accounted for 25-40% of
the
contribution of ICT to overall investment growth.
Investment
in education and
skills
underpins the growth of
a
skilled workforce.
Education
and skills, which underpin the growth of a skilled workforce,
account
for the bulk of investment in knowledge. In 1999, 65% of the
population
aged 25-64 in the OECD area had completed upper secondary
schooling.
The share is more than 20 percentage points higher in the United
States
and Japan than in the European Union. In 1999, 14% of the OECD-area
population
aged 25-64 had university-level education.
Human
resources in science
and
technology are
expanding…
In
1999, there were about 38 million workers (about 25% of the labour
force)
in highly skilled S&T-related occupations in the European Union. The
share
was highest – about one-third – in the Nordic countries (Sweden,
Denmark,
Finland) and in the Netherlands, Germany and Belgium. Human
resources
in science and technology (HRST) grew significantly between 1995
and
1999 in southern Europe, Ireland and Finland. The growth rate of HRST was
similar
in European Union countries and the United States (about 3% annually).
…
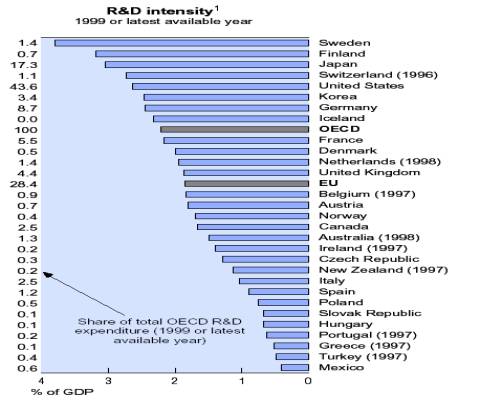
as is expenditure for R&D.
OECD-area
expenditure on R&D has increased considerably over the
past
two decades. It has grown by almost 4% a year and has accelerated since
the
mid-1990s. Most of the increase between 1994 and 1999 was due to the
United
States. During the 1990s, R&D expenditure grew by more than 13%
annually
in Ireland, Mexico and Iceland. In 1999, OECD countries allocated
about
USD 553 billion to R&D, or approximately 2.2% of overall GDP. Since the
mid-1990s,
R&D intensity has increased continuously in Japan and the United
States
and has remained more or less stable in the European Union.
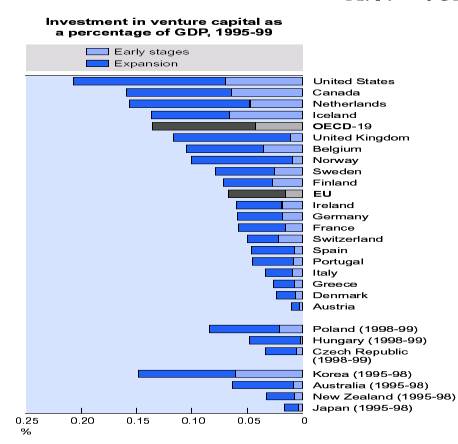
Innovation
relies also on
venture
capital.
Despite
a recent slowdown, venture capital remains a major source of
funding
for new technology-based firms. Between 1995 and 1999, it amounted
to
0.21% of GDP in the United States and 0.16% of GDP in Canada and the
Netherlands
for early and expansion stages. Almost half of venture capital
investment
in the OECD area is for ICT, representing more than 67% in the
United
States and over 53% in Ireland and Norway. Biotechnology is also of
growing
importance, accounting for the bulk of venture capital investments in
Hungary,
and about 15% in the United States.
The
role of business in R&D is increasing
Business
is the main source of
increased
spending on R&D.
The
business sector is the major source of R&D financing. In 1999, it
provided
more than 60% of domestic R&D funding in OECD countries, a slight
increase
from 1990. Over the decade, the business sector’s share increased
from
57% to 67% of total R&D funding in the United States; it remained stable
in
Japan at around 72% and increased from 52% to 55% in the European Union.
In
most countries, government’s role in funding R&D declined over the 1990s.
More
R&D spending is
directed
towards basic
research…
Most
countries spent a higher share of GDP on basic research in 1998-99 than
in
the early 1980s. Since 1995, the ratio of expenditure on basic research to GDP
has
been flat in the United States, but it has grown in Japan, France and Italy.
Relative
to GDP, Switzerland allocates close to 0.8% of GDP to basic research,
almost
twice as much as the United States or Japan. In Korea, Japan and Ireland, around
one-third of basic research is performed by the business sector.
…
with less going to defence…
During
the 1990s, the share of defence R&D budgets relative to GDP
dropped
in most countries, largely owing to the overall reduction in military
spending.
France, the United States and Sweden experienced the strongest
decline.
Nonetheless, more than half of the US government R&D budget is
allocated
to defence, as is around a third of the total R&D budget in the
United
Kingdom and around a quarter in France and Spain.
…
and more to health…
During
the 1990s, government support for health-related R&D rose
quickly
in Japan (10%) and the United States (8%), with growth rates about
double
that in the European Union (5%). Compared to the European Union
and
Japan, government support for health R&D is high in the United States.
In
2000, it represented about 0.2% of GDP, far above the figures for the
European
Union (0.05% in 1998) and Japan (0.03%). This difference is partly
due
to institutional differences. When appropriate adjustments are made,
however,
Finland, Austria and the Netherlands have health R&D budgets
relative
to GDP similar to that of the United States. The difference in
government
support for health R&D between the United States and the
European
Union also narrows sharply.
…
with a growing share
for
biotechnology.
A
significant and increasing part of health R&D concerns biotechnology.
Data
for biotechnology R&D are currently only available for 20 OECD
countries
and do not include the United States and Japan. They show that,
in
1997, public funding of biotechnology R&D amounted to approximately
USD
3.4 billion. Germany (USD 1.0 bi llion), the United Kingdom
(USD
0.7 billion) and France (USD 0.6 billion) account for the bulk of it.
Belgium
and Canada have the highest ratio of biotechnology R&D to total
government
budget appropriations for R&D (14% and 10%, respectively).
R&D
in the ICT sector also
contributes
significantly
to
overall R&D.
ICT
also accounts for a growing share of overall R&D. Data for 19 OECD
countries
indicate that, in 1998, R&D expenditure for ICT manufacturing was
approximately
USD 96 billion; for the ICT services industries, data for
11
OECD countries show expenditure of USD 18 billion. In 1998, Finland was
the
only country to allocate more than 1% of GDP to ICT-related manufacturing
R&D.
ICT-related R&D intensities of the large European economies are well
below
those of the United States and Japan. In the 1990s, the United Kingdom
is
the only large European country where ICT-related R&D increased slightly
in
manufacturing and services industries (by 1% and 3% a year, respectively).
In
manufacturing, ICT-related R&D decreased in Germany, France and Italy by
1%,
2% and 0.5%, respectively.
Knowledge
flows within and across economies take on greater importance
Innovation
increasingly relies
on
co-operation between firms
and
universities.
The
use and generation of knowledge depend not only on the creation of
knowledge
but also on flows of knowledge within and among economies.
Collaboration
between business and non-business entities is rising, and the
share
of R&D performed by the higher education and government sectors and
funded
by the business sector is increasing. It represented 6.1% and 4.1% of
higher
education and government research, respectively, in 1998. Data from
innovation
surveys show that firms with co-operation arrangements with higher
education
or government institutes account for around 10% of total employment.
International
co-operation in
science
and innovation
is
growing rapidly…
Production
of scientific research and technological know-how also
increasingly
depends on research conducted in other countries. In the mid-
1990s,
27% of scientific publications in the OECD area were the work of
multinational
teams and 7% of patents were the result of international
co-operative
research. In smaller European countries, such as Belgium,
Denmark
and Austria, over 40% of scientific publications have a foreign
co-author.
When intra-EU co-operation is factored out, researchers in the
United
States and the European Union have a similar propensity to
co-operate
with foreign researchers; in Japan, instead, international
co-operation
in science and technology is quite limited.
…
as is cross-border
ownership
of inventions.
More
and more technology is owned by firms from a country other than
the
inventor’s country of residence. In the mid-1990s, an average of 14% of all
inventions
in any OECD country were owned or co-owned by a foreign
resident.
Likewise, OECD countries owned around 15% of inventions made
abroad.
Foreign ownership of domestic inventions is high in several small
OECD
countries, but also in Canada and the United Kingdom, where US
companies
own a large share of inventions. Domestic ownership of foreign
inventions
is also high in small countries; 39% of all inventions owned by
Swiss
residents were invented abroad. In the United States, the share of
foreign
inventions in the patent portfolio is only 13%. Japan and Korea are the
least
internationalised in this respect.
Worker
mobility supports the
flow
of knowledge across borders…
Knowledge
flows also result from migration. In the United States, for
instance,
the largest number of scientists and engineers (S&Es) with S&E
doctorates
who were born elsewhere in the OECD area are from the United
Kingdom
and Canada; relatively few are from Germany or Japan. However,
three
times as many foreign-born scientists are from China and twice as many
from
India as from the United Kingdom. In 1998, for the 14 European countries
as
a whole, non-national HRST amounted to only 3%. However, European
countries
differ widely; Luxembourg employs by far the largest share of
non-nationals
(33%), followed by Austria, Belgium and the United Kingdom.
…
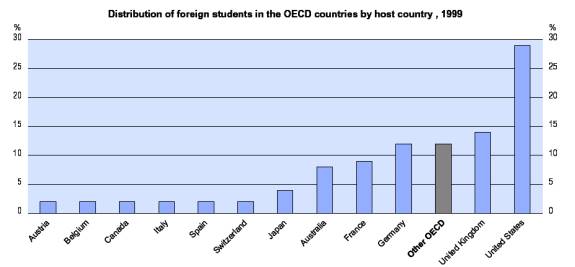
as does student mobility.
International
mobility of students also represents a potential flow of
qualified
workers. Five countries are host to more than 70% of all foreign
students
in OECD countries. The United States attracts 29% of foreign
students,
followed by the United Kingdom (14%) and Germany (12%).
English-speaking
countries account for over 50% of the OECD total. In
Switzerland,
Australia, Austria, Belgium and the United Kingdom, foreign
students
represent more than 10% of total enrolments. In Korea, Mexico and
Poland,
they account for less than 1%.
The
globalisation of the
knowledge
economy is
apparent
in the rapid growth
of
international transactions.
National
economies also integrate in other ways. Financial transactions
(e.g.
direct investment and portfolio investment) constitute the fastest growing
segment
of international transactions. The upsurge in direct
investment
and portfolio investment was especially rapid in the second half
of
the 1990s. However, such investment flows have proven highly volatile. The
lowering
of trade and non-trade tariff barriers has also contributed to a steady
rise
in international trade.
Trade
is growing rapidly,
particularly
in services…
The
share of trade in international transactions has remained persistently
high,
averaging 15% of OECD GDP in the 1990s. That of trade in goods is four
times
that of trade in services, despite the acceleration of the latter. In the
second
half of the 1990s, international trade in services as a share of GDP
picked
up slightly, partly as the result of the growing tradability of certain
services,
e.g. software, financial services and accounting. The trade-to-GDP
ratio
is only around 10% for the United States, Japan and the European Union
when
intra-EU trade flows are excluded. During the 1990s, the international
trade-to-GDP
ratio grew on average about 2% in the European Union and the
United
States but declined slightly in Japan.
…
and foreign direct
investment
has picked
up
in recent years...
Flows
of foreign direct investment (FDI) have surged in recent years,
owing
to renewed dynamism in the world economy and a favourable
international
investment environment. FDI flows as a percentage of GDP are
high
for Belgium-Luxembourg, New Zealand, Sweden, the Netherlands,
Switzerland
and the United Kingdom. They remain small in Turkey, Korea,
Japan
and Italy. In Germany, Japan and the United Kingdom, outward
investment
greatly exceeds inward investment, while Australia, Hungary,
Poland
and Spain receive more foreign capital than they invest abroad.
…
partly owing to increases in
mergers
and acquisitions.
Mergers
and acquisitions are the most common form of FDI. During the
1990s,
cross-border mergers and acquisitions increased more than five-fold
worldwide
on a value basis. The United States was the main target during the
1995-99
period, attracting on average four times as many deals in terms of
number
than the United Kingdom, the second target country. Germany and
France
took third and fourth place. During the 1990s, the most active sectors
at
global level were oil, automotive equipment, banking, finance and
telecommunications.
Multinational
firms also
account
for a growing share of
activity
in many countries…
The
share of turnover under foreign control in the manufacturing sector
ranges
from about 70% in Hungary and Ireland to under 2% in Japan. In the
period
1995-98, the shares of foreign affiliates in manufacturing turnover rose
almost
everywhere. In terms of manufacturing employment, their shares range
from
around 50% in Ireland, Luxembourg, and Hungary to 1% in Japan. In the
second
half of the 1990s, when manufacturing employment typically declined
in
national firms, it rose in foreign affiliates in all countries except Germany
and
Netherlands. In most cases, this reflected changes of ownership owing to
buy-outs
and acquisitions.
…
and increasingly
in
the services sector
as
well.
The
share of turnover under foreign control in the services sector is over
20%
for Hungary, Belgium, Ireland and Italy. In terms of employment, the
share
of foreign affiliates ranges from 19% in Belgium and around 14% in
Hungary
and Ireland to less than 1% in Japan. In all countries except Norway
and
Finland, the share of turnover of foreign affiliates was greater for
manufacturing
than for services.
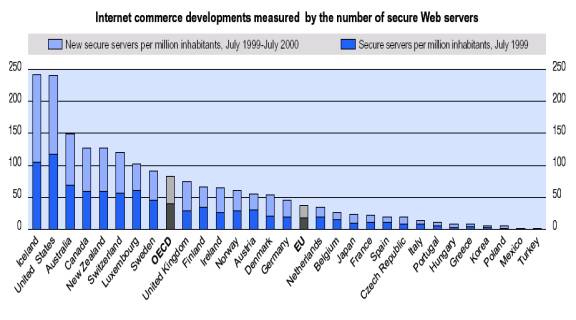
Information
and communications technologies are diffusing rapidly
The
knowledge-based economy
is
accompanied by the rapid diffusion of ICT,
especially
the Internet.
The
diffusion of information and communications technology is a key
enabler
of the knowledge-based economy. Access to ICT has grown rapidly
over
the past years. At the end of 1999, OECD countries had more than one
network
access channel for every two inhabitants and several countries had
more
than one access channel per inhabitant. The Nordic countries maintain a
clear
lead over the rest of the OECD area when connectivity provided by
wireless
networks is taken into account. Internet technologies are diffusing
very
rapidly. At the end of 1999, there were nearly 50 million Internet
subscribers
in the United States, close to 11 million in Japan and in Korea,
9
million in Germany, 7.4 million in the United Kingdom and 6.2 million in
Canada.
A ranking of countries in terms of Internet subscribers per
100
population shows high levels of take-up in Korea, Sweden, Denmark,
Canada,
the United States, Netherlands, Iceland and Norway.
Access
to the Internet is
soaring
in most countries…
Personal
computers are still the main device used by households to access
the
Internet. In most countries for which data are available, more than half of all
households
now have computers. In 2000, there was a noticeable gap between
northern
European countries such as the Netherlands (69%), Denmark (65%) and Sweden (60%)
and southern European countries such as Italy (28%), France (27%) and Turkey
(12%). Internet access in households is soaring everywhere, especially in Italy
where the access rate grew by 144% between 1999 and 2000, as well as in the
United Kingdom (75%), Japan (74%) and France (73%).
…
as is its use, but Internet
transactions
remain limited.
The
share of adults using the Internet from any location is also increasing
rapidly.
More than half of the adult population now uses the Internet in
Sweden
(68%), Denmark (62%), Finland (54%) and Canada (53%). The Internet
is
still mostly used to search for information, and the propensity to carry out
transactions
over the Internet varies widely. In Sweden, 43% of Internet users
purchase
over the Internet, followed by the United Kingdom (33%), the
United
States (30%) and Denmark (29%). Business use of the Internet is
increasing
very rapidly. Internet penetration in businesses with ten or more
employees
has reached 80-90% in the Nordic countries, Australia, Canada, the
Netherlands
and the United Kingdom. In the Nordic countries, over 40% of
employees
use the Internet in their daily work. The use of the Internet to
conduct
transactions, although rising fast, is limited. The value of Internet
sales
in 2000 ranged between 0.4% and 2% of total sales, while electronic sales
(including
those over all computer-mediated networks) reached almost 6% in
the
United Kingdom.
The
rate of diffusion differs
between
users and across
countries…
Internet
penetration in households is strongly affected by household
income.
The difference between Internet access in households belonging to the
lowest
and highest income quartiles is highest in the United States and lowest in
Denmark.
Internet usage rates are much higher in large than in small enterprises
and
vary in different economic sectors. The most intensive business users are
generally
firms in finance and insurance, business services and wholesale trade.
…
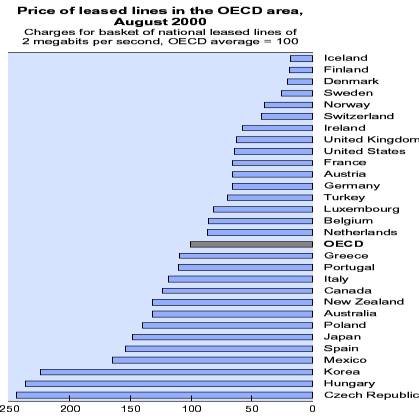
partly owing to differences
in
access costs.
A
key determinant of cross-country differences in the diffusion of the
Internet
and electronic commerce is access cost. There are large differences
in
prices of leased lines, which provide the infrastructure for business-tobusiness
electronic
commerce. The Nordic countries have the lowest charges,
at
about one-fifth the OECD average. Differences in Internet access cost for
consumers
are even more marked. At peak times, countries which
traditionally
have had unmetered local calls – Australia, Canada, Mexico, New
Zealand,
the United States – are among the least expensive.
The
structure of OECD economies and of trade reflects the increasing role
of
knowledge
As
knowledge has grown in
importance,
so has the share of
knowledge-intensive
industries…
By
the end of the 1990s, high- and medium-high technology
manufacturing
accounted for about 9% of total OECD value added. The
share
of high- and medium-high technology industries was largest in
Ireland,
where they accounted for over 16% of value added, and in Korea
(12.6%).
Among the G7 countries, Germany and Japan had the largest shares
of
such industries, at 11.7% and 10.7% of total value added, respectively. In
many
OECD countries, including the United States, this sector has grown
rapidly
over the 1990s.
…
and knowledge-intensive
services.
Knowledge-based
“market” services accounted for 18% of total value added
in
the OECD area. Post and telecommunications, finance and insurance and
business
services are typically the most intensive technology users among
market
services. These sectors accounted for almost 25% of total value added in
Switzerland.
Among the G7 countries, the United States and the United Kingdom
had
the largest knowledge-intensive services sector. In Mexico and Greece, this
sector
accounted only for about 10% of value added. If knowledge-intensive
“non-market”
services (education and health) are included, knowledge-intensive
services
account for about 29% of total value added in the OECD area.
The
changing structure
of
OECD economies is also
reflected
in business R&D.
Services
have a much smaller share in R&D than in GDP. In 1998, they
accounted
for about 17% of total business sector R&D in the OECD area, an
increase
of 2% from 1992. Countries differ widely, however. In Norway, 48% of
total
business R&D is carried out in the services sector, 37% in Denmark and
31%
in the United States. Although the share of services R&D increased over
the
1990s in Germany, France and Japan, these countries still have the lowest
share
of services R&D (less than 10%).
The
ICT sector has grown very
rapidly
in several OECD countries.
The
ICT sector makes a substantial contribution to the economy. In 1999, ICT
value
added represented between 5% and 14% of business sector value added in OECD
countries. The importance of ICT supply has been increasing, not only in
countries like Hungary, the Czech Republic and Mexico, which are catching up in
terms of infrastructure, but also in Finland, Sweden, Norway, the Netherlands
and the United Kingdom. In Finland, the ICT sector’s share of value added
increased by 4.7 percentage points over the 1995-99 period. It now represents
over 13% of total business sector value added. The ICT sector is a major source
of employment growth. OECD employment in the sector grew by over 12% in the
1995-99
period, i.e. an average annual rate of over 3% a year, double that of
overall business sector employment. ICT services are driving this growth.
International
trade
in
high-technology goods
is
also rising rapidly…
The
growing importance of knowledge-intensive industries is also visible
in
the structure of OECD manufacturing trade. The share of high-technology
industries
in total OECD trade increased from 18% in 1990 to one-quarter
in
1999. The highest growth rates in OECD manufacturing trade in the 1990s
were
in high-technology industries: pharmaceuticals, radio, television and
communication
equipment and computers. The shares of medium-low- and
low-technology
industries have gradually declined.
…
although only a few OECD
countries
have a strong comparative advantage in
high-technology
industries.
In
spite of the growing importance of high-technology industries in overall
trade,
few OECD countries specialise in high- and medium-high-technology
industries.
In 1999, the structural surplus in these industries represented more
than
15% of total manufacturing trade for Japan, about 7.5% for Switzerland and
around
5% for Germany, Mexico and the United States. A considerable number of OECD
countries still have a strong comparative advantage in medium-low technology and
low-technology industries. The structural surplus of Turkey, New
Zealand
and Iceland in these industries accounted for more than 20% of total
manufacturing
trade. For most OECD countries, these specialisation patterns
have
changed little over the past decade.
Knowledge
and innovation increasingly underpin economic performance
Innovation
is a key driver
of
economic growth…
Recent
patterns show that knowledge and innovation make a large
contribution
to growth. A high share of investment in fixed capital goes for ICT.
Moreover,
the overall efficiency of the use of capital and labour in the
production
process, or multi-factor productivity (MFP), increased rapidly in
Ireland,
Finland, Australia, Canada and the United States in the second half of
the
1990s. More rapid MFP growth points to faster technological progress.
Furthermore,
rapid productivity growth in high-technology sectors such as ICT
has
contributed strongly to growth in several countries.
…
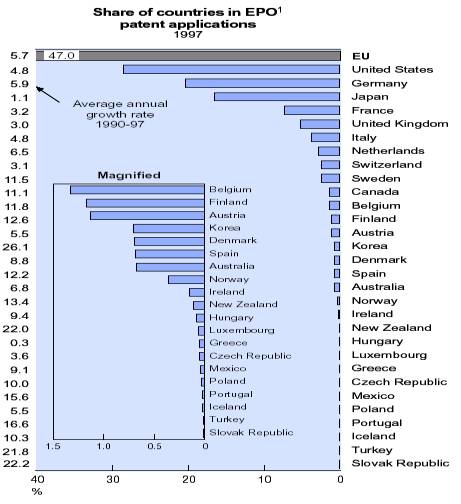
and patenting is
accelerating,
although
differences
among OECD
countries
are large.
Indicators
of patenting confirm the brisk pace of technological progress.
Over
the 1990-97 period, patent applications at the European Patent Office
increased
annually by 5.7% for the European Union, 4.8% for the United States
and
1.1% for Japan. During the 1990s, growth rates for patents in ICT (8%) and
biotechnology
(10%) for the OECD area were almost twice that of total patent
applications
(5%). Indicators of patent families – patents taken at the European
Patent
Office, the US Patent and Trademark Office and the Japanese Patent
Office
to protect a single invention – show that there were about 32 000 patent
families
in the OECD area in 1995. The United States accounted for about 35%,
followed
by the European Union (32%) and Japan (27%). When population size
is
taken into account, Switzerland patents the most by far in the OECD area. In
1995,
there were close to 100 patent families per million population in
Switzerland,
far above Sweden (74) and Japan (69).