Climate -- A geologic perspective. Chapter 19 in textbook
Carbon dioxide levels in the atmosphere are now over 410 ppm. The annual average hit 400 ppm in 2014 and is going up by about 2 ppm every year due to buring fossil fuels. Carbon dioxide levels in the atmosphere are very well known, carefully measured, and increasing rapidly due to burning fossil fuels, and greenhouse effect is one of the best understood aspects of climate science (and has been known for over 100 years).
Understanding the climate change "debate" (there really is no debate -- except on TV).
3. Changes in the Earth's orbit -- causes changes in the amount of energy absorbed by the surface of the Earth.
C. Interrelationships: Global climate is complex -- there are many feedback mechanisms (both positive and negative) and some parameters amplify others (e.g. Greenhouse gases can increase after warming is initiated by changes in the Earth's orbit and amplify the resulting global warming). Here is a great series of web pages that explain factors that play roles in climate change from NASA. Here is a great set of resources from the National Oceanic and Atmospheric Administration (NOAA).
Here is a recent report (National Climate Assessment Report) that summarizes several impacts of climate change on the U.S. from the U.S. Global Change Research Program.
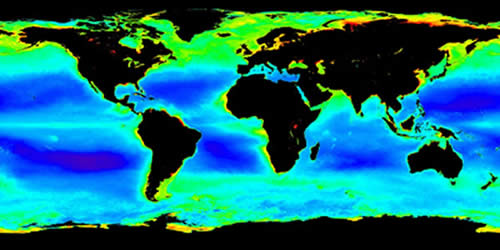
Surface water productivity as shown by chlorophyll concentration (red colors represent high concentrations and blue represents low ones) in the surface ocean. Measured by the SeaWIFS, photo from NASA's Web site.
Global Climate is getting warmer:
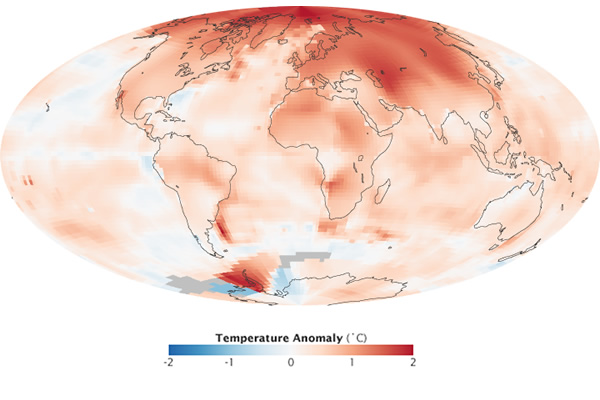
The map of the world on the right shows the temperature anomalies (red colors are warmer, blue ones are colder) relative to the 30-year period 1951-1980. From NASA: http://earthobservatory.nasa.gov/IOTD/view.php?id=47628&src=eoa-iotd (accessed Dec. 14, 2010.
See this link to compare temperature anomalies by decade since 1880.
People who doubt that global warming is occurring cite the evidence of "urban heat islands". They say that instrumental temperature records are biased toward data gathered in and near cities, which are warmer than the surrounding area. A recent study, however, has shown this to be untrue, and that the temperature record presented by NASA, NOAA, and other sources around the world are correct. Dark city roofs and parking lots can be significantly hotter than surrounding areas, but the urban island effect has not played a significant role in global temperature data.
Here is a good summary of this discussion. Dr. Richard Muller, a climate change skeptic, conducted an independent assessment of the global temperature instrument record and found that there is no "urban heat island" effect on the data.
What we know:
- The Earth is getting warmer.
- The lower atmosphere (troposphere) is getting warmer at the same time the upper atmosphere (stratosphere) is cooling.
- The oceans are warming.
- The greenhouse effect is scientifically well understood -- and has been known for about 150 years.
- Greenhouse gas (methane, carbon dioxide, CFC's, ozone, etc) concentrations are increasing rapidly *.
- Greenhouse gas concentration changes coincide with global climate change in the past.
- It will take at least 1000 years for the carbon dioxide we have put into the atmosphere by burning fossil fuels to be be absorbed by the oceans and terrestrial vegetation.
- Over millions of years, the global climate has been much warmer and cooler than today.
- Plants can take up carbon dioxide, but a recent study has shown that increased plant growth will have a small effect in slowing global warming.
- The world's glaciers are melting fast. See the evidence here.
- Global sea levels are rising.
See this video for a good summary of what has been known about climate change over the last 30+ years.
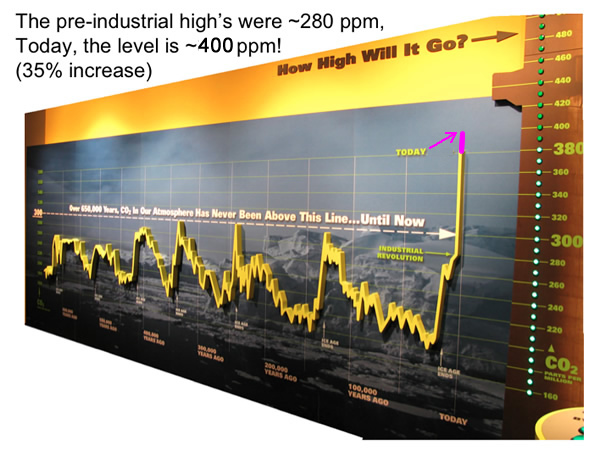
The graph above is from a display at the Birch Aquarium at Scripps Oceanographic Institution in San Diego. It shows the concentration of carbon dioxide in the Earth's atmosphere over the last 500,000 years. Here is a link to a nice video from the Birch Aquarium that deals with global warming.
Can Sunspot Activity Explain Global Warming?
"I absolutely do not believe in the science of man-caused climate change,"
"It's not proven by any stretch of the imagination."
"It's far more likely that it's just sunspot activity or just something in the geologic eons of time,"
Ron Johnson, August 2010 (from http://www.jsonline.com/news/statepolitics/100814454.html accessed December 10, 2010)
People are entitled to their own beliefs, but not their own facts. Sunspots are dark areas that represent zones marked by intense magnet fields on the sun's surface and are often accompanied with faculae, which are very bright areas. Both are more abundant during times of increased solar activity, but the effect on global climate, although likely small, is not straight forward. Solar activity has varied over time, and some variations in the past have occurred with times of climate change, but sunspot activity has decreased over the last 30 years -- while global temperature has been increasing:
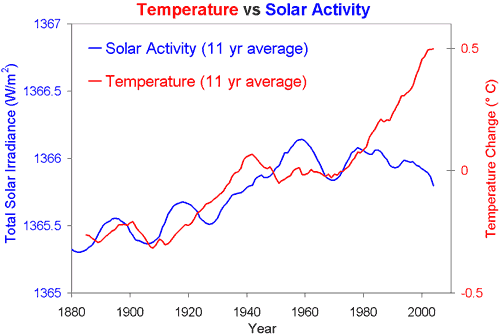 |
From http://www.skepticalscience.com/solar-activity-sunspots-global-warming.htm (accessed Dec. 10, 2010). |
Here is a great video that discusses the relationship of sunspots to global climate change.
Here is the bottom line regarding sunspots and global climate change from the Skeptical Science web page (accessed Dec. 2, 2010).
"...neither direct nor indirect solar influences can explain a significant amount of the global warming over the past century, and certainly not over the past 30 years. As Ray Pierrehumbert said about solar warming,
“That’s a coffin with so many nails in it already that the hard part is finding a place to hammer in a new one.”"
Scientists believe that we are entering minimum period (Grand Minimum) of activity that has not occurred since about 300 years ago. This time, however, human-driven climate global warming will probably mean that the sunspot minimum will not result in global cooling.
This NASA web site provides in-depth explanation of sunspots, sunspot activity cycles, and predictions into the future.
Press sources often try to be "fair and balanced" -- but end up giving equal time to unsupported, wild competing ideas. Here is a 2004 story aired by the British Broadcasting News service that presents a contradictory view of sunspot influences on global climate. It first suggests that sunspot activity may be causing global climate change, but then at the end of the article the author states that sunspot activity does not correlate to global temperature rise in the last 20 years. "Over the past 20 years, however, the number of sunspots has remained roughly constant, yet the average temperature of the Earth has continued to increase."
Here is another good web site to check out sunspots and their effect on climate; here is another assessment of solar cycles and climate change, and here is another.
Here is an article that discusses the fact that the lower atmosphere (troposphere) is warming while the upper atmosphere (stratosphere) is cooling, which suggests that greenhouse warming, and not sunspot activity, is causing global warming.
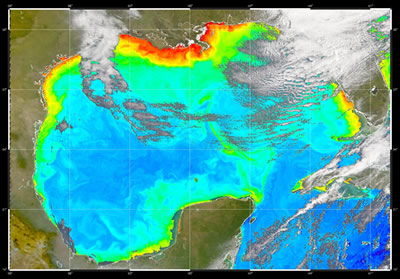
Productivity in the Gulf of Mexico as shown by the chlorophyll concentration (red colors represent high concentrations and blue represents low ones) in the surface water. Photo from NASA's SeaWIFS satellite page,
News organizations are often involved in trying confuse (mislead) people about climate science.
Greenhouse gas rise today is about 30 times greater than during ancient intervals of global warming.