MATH 201 Applied Statistics
Fall 2010
Section 001 8:00 to 9:00 M W F
Section 002 9:10 to 10:10 M W F
Instructor:
Dr. Chris
Edwards Phone: 424-1358 or 948-3969 Office: Swart 123
Classroom: Swart 203 Text: Introduction to the Practice of Statistics 6th edition, by David S. Moore and George P. McCabe
Required
Calculator: TI-83, TI-83 Plus, or
TI-84 Plus, by Texas Instruments. Other TI graphics calculators (like the
TI-86) do not have the same statistics routines we will be using and will cause
you troubles.
Catalog
Description: An introduction to applied statistics using a statistical
computing package such as MINITAB.
Topics include: Descriptive statistics, elementary probability, discrete
and continuous distributions, interval and point estimation, hypothesis
testing, regression and correlation.
Credit cannot be earned for both PBIS 189 and Mathematics 201. Prerequisite: Mathematics 104 or 108
with a grade of C or better.
Course
Objectives: (Click
here for full document.) The goal of
statistics is to gain understanding from data. This course focuses on critical thinking and active
learning. Students will be engaged
in statistical problem solving and will develop intuition concerning data
analysis, including the use of appropriate technology.
Specifically
students will develop
• an interest and
aptitude in applying statistics to other areas of human inquiry
• an awareness of the
nature and value of statistics
• a sound, critical
approach to interpreting statistics, including possible misuses
• facility with
statistical calculations and evaluations, using appropriate technology
• effective written and
oral communication skills
Grading: Final grades are based on 500 points:
|
|
Topic |
Points |
Tentative Date |
|
Exam 1 |
Descriptive Statistics |
80 pts. |
October 8 |
|
Exam 2 |
Sampling, Probability, and the CLT |
80 pts. |
November 12 |
|
Exam 3 |
Statistical Inference |
80 pts. |
December 17 |
|
Group Presentations |
20 Points Each |
60 pts. |
Biweekly |
|
Quizzes |
10 Points Each |
100 pts. |
Weekly |
|
Homework |
10 Points Each |
100 pts. |
Weekly |
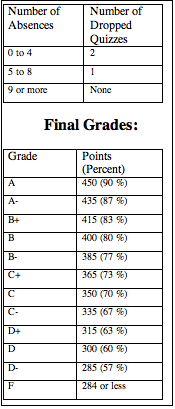 Attendance is a
very important component of success in my class because many of the skills and
lessons we will learn will be a direct result of classroom activities that
cannot be reproduced easily. Thus, final grades are based on attendance as well
as total points earned. The number
of quiz scores that may be dropped is based on absences.
Attendance is a
very important component of success in my class because many of the skills and
lessons we will learn will be a direct result of classroom activities that
cannot be reproduced easily. Thus, final grades are based on attendance as well
as total points earned. The number
of quiz scores that may be dropped is based on absences.
Presentations:
There will be three presentations, each worth 20 points. The descriptions of the presentations
are in the Day By Day Notes. I
will assign you to your groups for these presentations randomly, but I want to
avoid you having the same members each time. I expect each person in a group to contribute to the work;
you can allocate the work in any way you like. If a group member is not contributing, see me as soon as
possible so I can make a decision about what to do. Part of your presentation grade will be based on your own
evaluations of how each person contributed to the presentation. The topics are: 1 - Displays and Regression (October
6). 2 - Sampling and Probability
(November 10). 3 - Statistical
Hypothesis Testing (December 15).
Quizzes:
Approximately once a week, we will have a quiz on the current
material. These quizzes are a way
for me to provide feedback to you on your progress in the course. You will be allowed to drop up to 2
quizzes, based on your course attendance.
Homework:
I will collect three homework problems approximately once a
week. The due dates are listed on
the course outline below. While I
will only be grading three problems, I presume that you will be working on many
more than just the three I assign.
I suggest that you work together in small groups on the homework for
this class. What I expect is a well thought-out, complete discussion of the
problem. Please don’t
just put down a numerical answer; I want to see how you did the problem. (You won’t get full credit for just numerical
answers.) The method you use is
much more important to me than the final answer. Important Grading Feature: If your homework percentage is lower than your exam
percentage, I will replace your
homework percentage with your exam percentage. Therefore, your homework grade cannot be lower than your
exam grade.
Office
Hours: Office hours are times when I
will be in my office to help you.
There are many other times when I am in my office. If I am in and not busy, I will be
happy to help. My office hours for
Fall 2010 semester are 10:20 to 11:00, Monday, Wednesday, and Friday, and 2:00
to 2:50 Tuesday, or by appointment.
Philosophy: I
strongly believe that you, the student, are the only person who can make
yourself learn. Therefore,
whenever it is appropriate, I expect you to “discover” the statistics
we will be exploring. I do not
feel that “lecturing” to you will
teach you how to do statistics. I hope
to be your “guide” while we learn
some statistics, but you
will need to do the learning. The
textbook we will be using for this class will require you to actually read it
to master the material.
My
idea of education is not “Teaching is telling and learning is
listening”. I believe that you must be active in
the learning process to learn well.
My job as a teacher, therefore, is not to tell you the answers to the problems we will encounter;
rather it is to point you in a direction that will allow you to see the
solutions yourselves. To
accomplish that goal, I will work to find different interactive activities for
us to work on. Your job is to use
me, to use your text, to use your friends, and any other resources.
|
Homework 1, due
September 21 |
Chapter 1: 1.18
page 23 |
|||
|
Homework 2, due
September 28 |
Chapter 1: 1.56
page 48 |
|||
|
Homework 3, due
October 5 |
Chapter 2: 2.20
page 98 |
|||
|
Homework 4, due
October 21 |
Chapter 3: 3.18
page 192 |
|||
|
Homework 5, due
October 30 |
Chapter 4: 4.22
page 255 |
|||
|
Homework 6, due
November 6 |
Chapter 4: 4.80
page 287 |
|||
|
Homework 7, due
November 20 |
Chapter 5: 5.48
page 347 |
|||
|
Homework 8, due
December 2 |
Chapter 6: 6.32
page 371 |
|||
|
Homework 9, due
December 9 |
Chapter 6: 6.122
page 413 |
|||
|
Homework 10, due
December 16 |
Chapter 8: 8.14
page 503 |
|||
|
Monday |
Wednesday |
Friday |
|
||
|
September 6 |
September 8 Day 1 |
September 10 Day 2 |
|
||
|
September 13 Day 3 |
September 15 Day 4 |
September 17 Day 5 |
|
||
|
September 20 Day 6 |
September 22 Day 7 |
September 24 Day 8 |
|
||
|
September 27 Day 9 |
September 29 Day 10 |
October 1 Day 11 |
|
||
|
October 4 Day 12 |
October 6 Day 13 |
October 8 Day 14 |
|
||
|
October 11 Day 15 |
October 13 Day 16 |
October 15 Day 17 |
|
||
|
October 18 Day 18 |
October 20 Day 19 |
October 22 Day 20 |
|
||
|
October 25 Day 21 |
October 27 Day 22 |
October 29 Day 23 |
|
||
|
November 1 Day 24 |
November 3 Day 25 |
November 5 Day26 |
|
||
|
November 8 Day 27 |
November 10 Day 28 |
November 12 Day 29 |
|
||
|
November 15 Day 30 |
November 17 Day 31 |
November 19 Day 32 |
|
||
|
November 22 Day 33 |
November 24 |
November 26 |
|
||
|
November 29 Day 34 |
December 1 Day 35 |
December 3 Day 36 |
|
||
|
December 6 Day 37 |
December 8 Day 38 |
December 10 Day 39 |
|
||
|
December 13 Day 40 |
December 15 Day 41 |
December 17 Day 42 |
|
||

Managed by chris
edwards:
click to email chris edwards
Last updated August 6, 2010